- Analytics
- Technical Analysis
Soybean Trade Technical Analysis - Soybean Trade Trading: 2018-12-03
The US and China can remove part of the mutual restrictions in foreign trade
The leaders of the United States and China will negotiate at the G20 summit. Among other things, they will discuss issues of US soybean imports to China. Will SOYB prices rise?
In April of the current year, China increased import duties on US soybeans by 25% in response to restrictions on exports of a number of Chinese goods to the United States. After that, soybean prices also fell by nearly a quarter. In 2017, China accounted for 56% of US soybean exports. US President Donald Trump and Chinese President Xi Jinping participate in the G20 summit, which will be held from November 30 to December 1, 2018 in Argentina. The United States accounts for 35% of the world soybean harvest and another 33% and 14% are produced by Brazil and Argentina. In world soybean exports, the United States accounts for 37%. Brazil accounts for 47% and Argentina - only 5%. In case of a reduction in customs tariffs and resumption of US soybean supplies to China, its prices may noticeably increase.
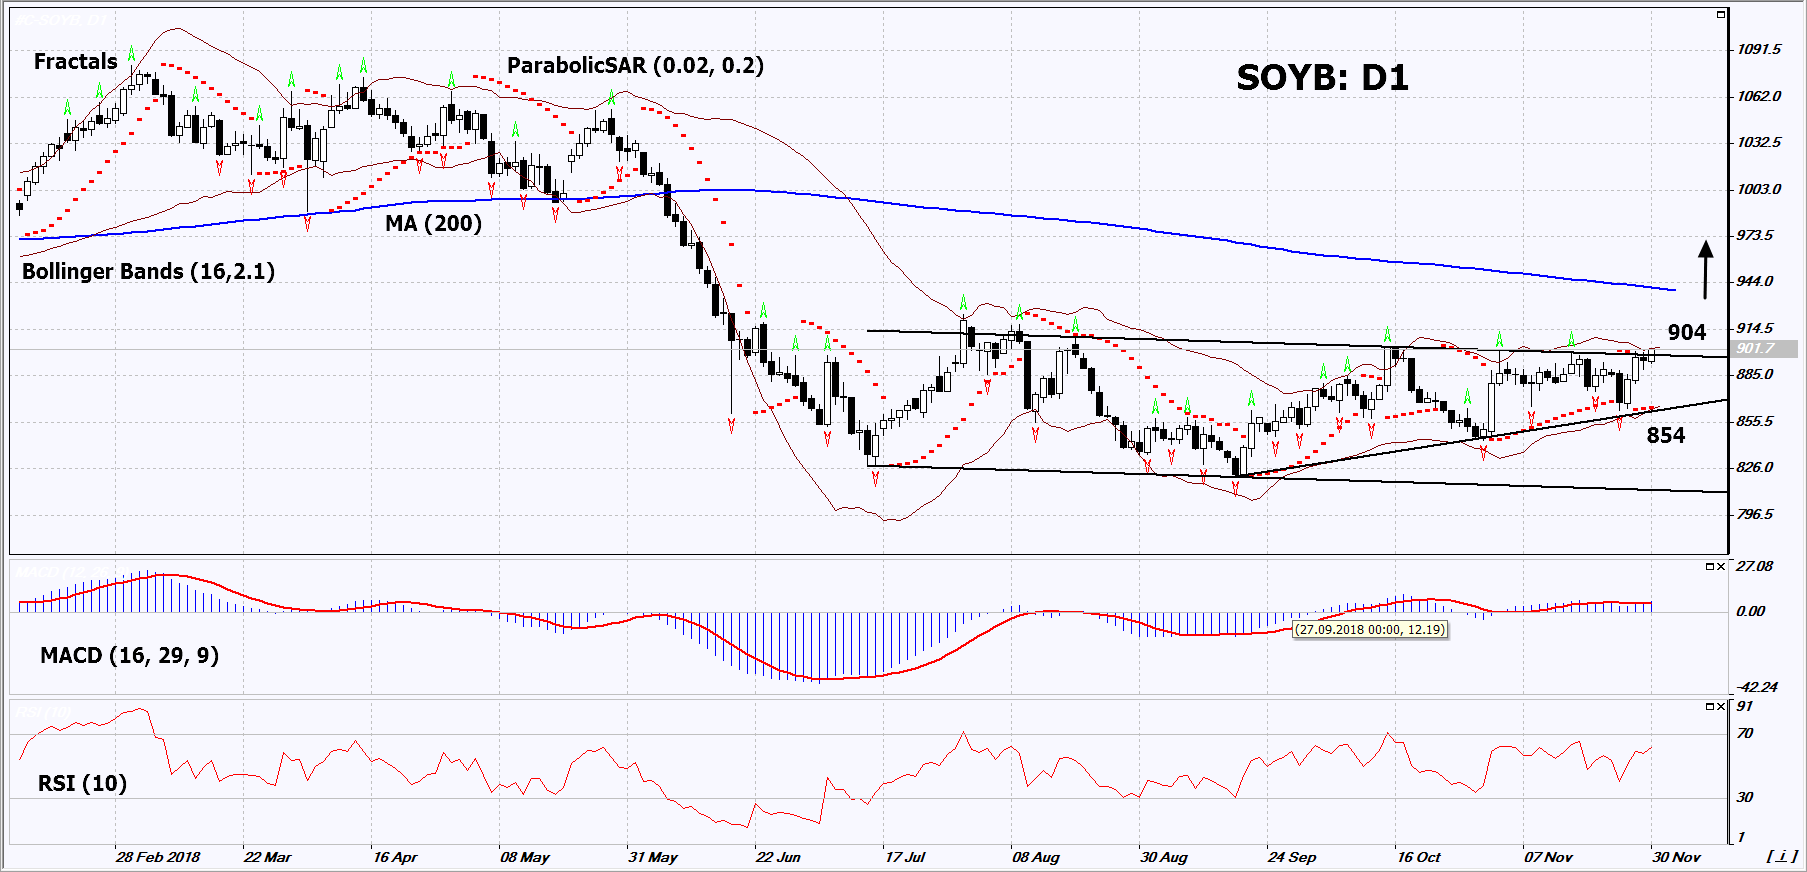
On the daily timeframe, SOYB: D1 approached the upper boundary of the neutral range. A number of technical analysis indicators formed buy signals. The further price increase is possible in case of a resumption of demand by non-Chinese buyers and a reduction in duties.
- The Parabolic indicator gives a bullish signal.
- The Bollinger bands have narrowed, which indicates low volatility. Both bands are titled upwards.
- The RSI indicator is above 50. It has not reached the overbought area yet. No divergence.
- The MACD indicator gives a bullish signal.
The bullish momentum may develop in case SOYB exceeds the three last fractal highs and the upper Bollinger band at 904. This level may serve as an entry point. The initial stop loss may be placed below the last fractal low, the lower Bollinger band and the Parabolic signal at 854. After opening the pending order, we shall move the stop to the next fractal low following the Bollinger and Parabolic signals. Thus, we are changing the potential profit/loss to the breakeven point. More risk-averse traders may switch to the 4-hour chart after the trade and place there a stop loss moving it in the direction of the trade. If the price meets the stop level (854) without reaching the order (904), we recommend to close the position: the market sustains internal changes that were not taken into account.
Summary of technical analysis
| Position | Buy |
| Buy stop | Above 904 |
| Stop loss | Below 854 |
- Get Certificate

Note:
This overview has an informative and tutorial character and is published for free. All the data, included in the overview, are received from public sources, recognized as more or less reliable. Moreover, there is no guarantee that the indicated information is full and precise. Overviews are not updated. The whole information in each overview, including opinion, indicators, charts and anything else, is provided only for familiarization purposes and is not financial advice or а recommendation. The whole text and its any part, as well as the charts cannot be considered as an offer to make a deal with any asset. IFC Markets and its employees under any circumstances are not liable for any action taken by someone else during or after reading the overview.
