- Analytics
- Technical Analysis
Gas Ruble Technical Analysis - Gas Ruble Trading: 2019-02-20
Gas reserves have reduced in the US
In this review, we suggest considering the personal composite instrument (PCI) “Gas vs. the Russian ruble”. It reflects the price dynamics of US natural gas against the Russian ruble. Will the GAS/RUB rise?
Such a movement means that natural gas prices are rising in the US, and the ruble is weakening. According to forecasts, the demand for natural gas in the United States will increase this week to 120.3 billion cubic feet per day from 116 billion because of the cold snap. Gas is widely used for heating. As of February 15, natural gas reserves in the US amounted to 1,728 trillion cubic feet, which is the minimum since 2014 and is 16.4% lower than the 5-year average level. The weakening of the Russian ruble may be because of new sanctions. Last week, a group of US senators proposed a new bill providing for additional economic sanctions against Russia.
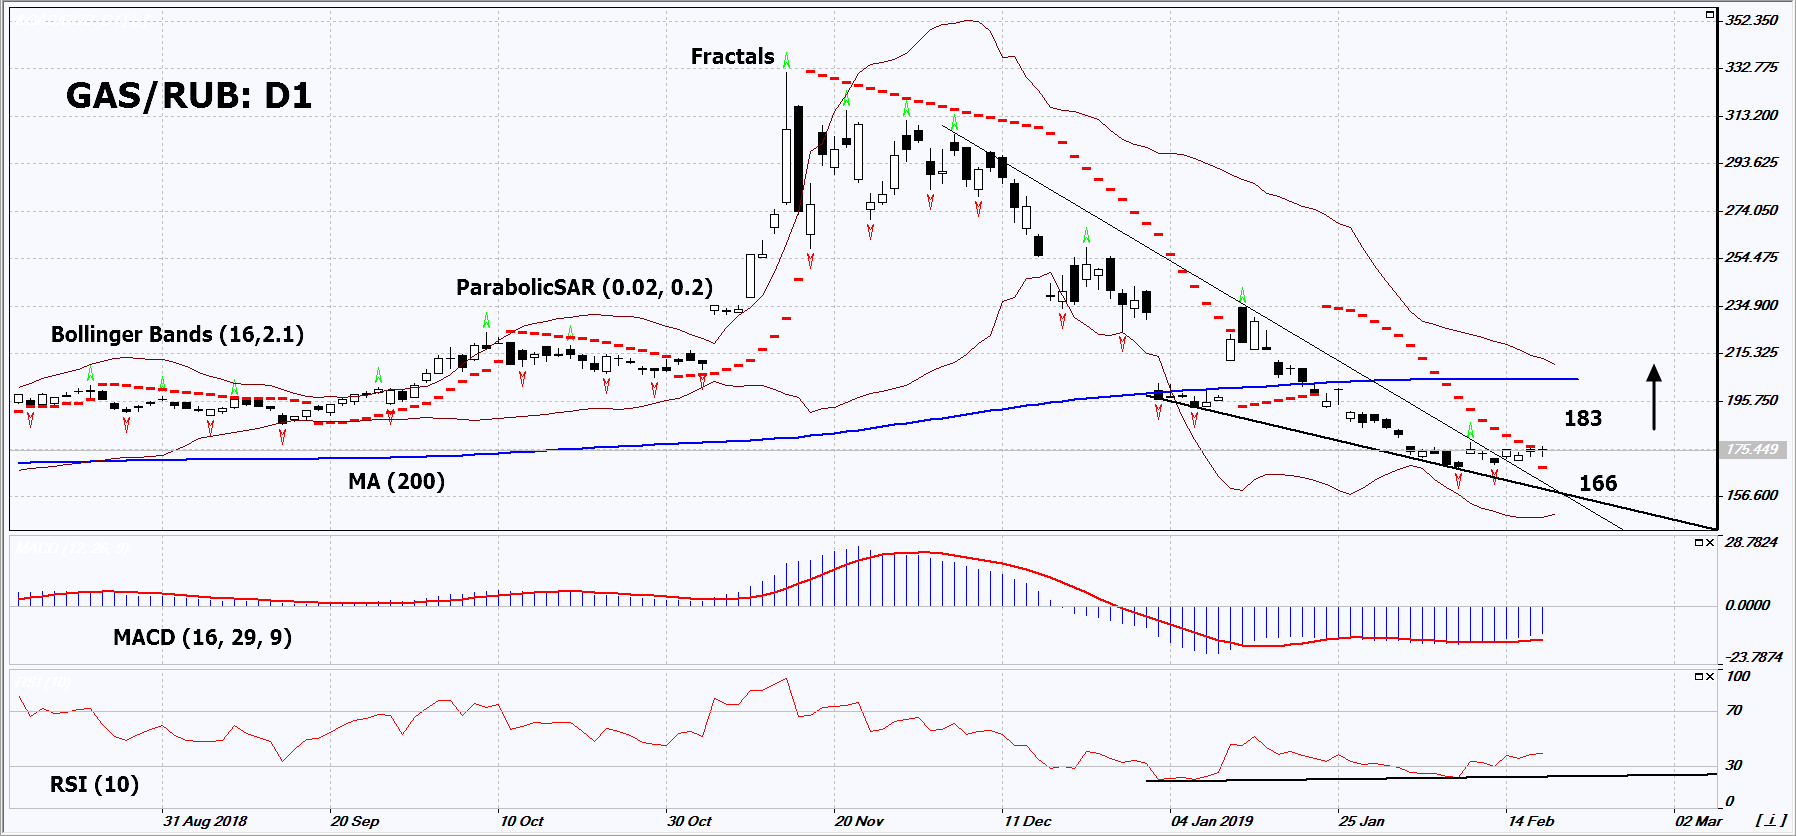
On the daily timeframe, GAS/RUB: D1 has moved from the downtrend to the neutral one. A number of technical analysis indicators formed buy signals. The further price increase is possible in case of an increase in demand for gas in the US and the weakening of the Russian ruble.
- The Parabolic Indicator gives a bullish signal.
- The Bollinger bands have narrowed, which indicates low volatility. The lower Bollinger band is titled upwards.
- The RSI indicator is below 50. It has formed a positive divergence.
- The MACD indicator gives a bullish signal.
The bullish momentum may develop in case GAS/RUB exceeds the last fractal high at 183. This level may serve as an entry point. The initial stop loss may be placed below the two last fractal lows and the Parabolic signal at 166. After opening the pending order, we shall move the stop to the next fractal low following the Bollinger and Parabolic signals. Thus, we are changing the potential profit/loss to the breakeven point. More risk-averse traders may switch to the 4-hour chart after the trade and place there a stop loss moving it in the direction of the trade. If the price meets the stop level (166) without reaching the order (183), we recommend to close the position: the market sustains internal changes that were not taken into account.
Summary of technical analysis
| Position | Buy |
| Buy stop | Above 183 |
| Stop loss | Below 166 |
- Get Certificate

Note:
This overview has an informative and tutorial character and is published for free. All the data, included in the overview, are received from public sources, recognized as more or less reliable. Moreover, there is no guarantee that the indicated information is full and precise. Overviews are not updated. The whole information in each overview, including opinion, indicators, charts and anything else, is provided only for familiarization purposes and is not financial advice or а recommendation. The whole text and its any part, as well as the charts cannot be considered as an offer to make a deal with any asset. IFC Markets and its employees under any circumstances are not liable for any action taken by someone else during or after reading the overview.
