- Analytics
- Technical Analysis
EUR/GBP Technical Analysis - EUR/GBP Trading: 2018-07-09
Will there be a soft Brexit?
Market participants believe that the UK will not be able to agree with European officials on a number of benefits in case of the withdrawal from the EU. Will the EURGBP grow, if there will not be the so-called "soft Brexit"?
British Prime Minister Teresa May will present her plan for Brexit in the parliament of her country on Friday night. Earlier, British Foreign Secretary Boris Johnson and former Prime Minister (2010-2016) David Cameron said that it is the worst of all possible options. In addition, according to The Guardian, the head of the British Brexit commission David Davis said that the new customs proposals of Therese May look "unworkable" and expressed the view that the EU would reject her plan. In July 10, significant macroeconomic indicators for May will be published in the UK: the industrial production, the monthly GDP and the trade balance. It should be emphasized that the success of the UK in negotiations on the withdrawal from the EU can reverse EURGBP down. An important factor may be the visit of Donald Trump to Great Britain on July 12.
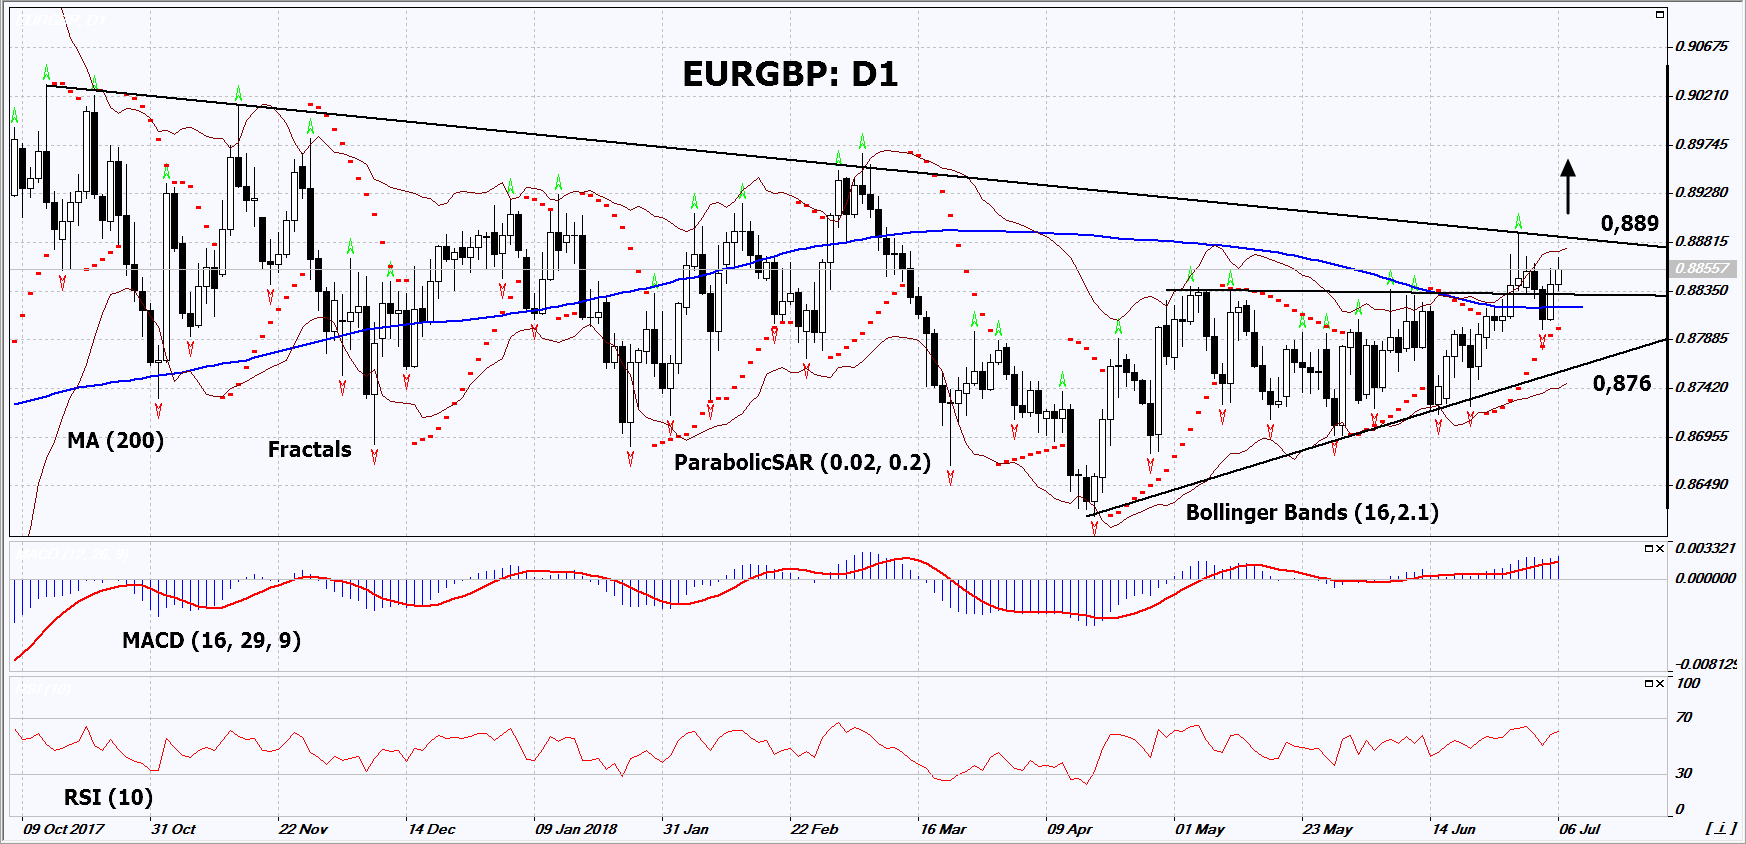
On the daily timeframe, EURGBP: D1 is trying to move upward from the triangle and has approached the resistance line of the long-term falling channel. It should be breached up before opening a buy position. The further price increase is possible in case of successful negotiations on Brexit for the UK.
- The Parabolic indicator gives a bullish signal.
- The Bollinger bands have widened, which indicates high volatility. They are titled upward.
- The RSI indicator is above 50. No divergence.
- The MACD indicator gives a bullish signal.
The bullish momentum may develop in case EURGBP exceeds the last high, the upper Bollinger band and the resistance line of the downtrend at 0.889. This level may serve as an entry point. The initial stop loss may be placed below the last fractal low, the 200-day moving average line, the Parabolic signal and the support line of the triangle at 0.876. After opening the pending order, we shall move the stop to the next fractal low following the Bollinger and Parabolic signals. Thus, we are changing the potential profit/loss to the breakeven point. More risk-averse traders may switch to the 4-hour chart after the trade and place there a stop loss moving it in the direction of the trade. If the price meets the stop level (0.876) without reaching the order (0.889), we recommend to close the position: the market sustains internal changes that were not taken into account.
Summary of technical analysis
| Position | Buy |
| Buy stop | Above 0.889 |
| Stop loss | Below 0.876 |
- Get Certificate

Note:
This overview has an informative and tutorial character and is published for free. All the data, included in the overview, are received from public sources, recognized as more or less reliable. Moreover, there is no guarantee that the indicated information is full and precise. Overviews are not updated. The whole information in each overview, including opinion, indicators, charts and anything else, is provided only for familiarization purposes and is not financial advice or а recommendation. The whole text and its any part, as well as the charts cannot be considered as an offer to make a deal with any asset. IFC Markets and its employees under any circumstances are not liable for any action taken by someone else during or after reading the overview.
