- Analytics
- Technical Analysis
AUD/NZD Technical Analysis - AUD/NZD Trading: 2019-04-19
Australian expansion and slowing New Zealand bullish for AUDNZD
Private sector expanded in Australia while inflation declined in New Zealand. Will the AUDNZD continue gaining?
Latest economic data from Australia were positive while New Zealand indicators softened. Australia’s business activity recorded an expansion in April after contraction in preceding month: Commbank Australia Composite PMI index rose to 50.6 from 49.5 in March, readings above 50.0 indicate expansion while lower readings mean contraction. And while the unemployment up-ticked to 5% in March from 4.9%, it was due to up-tick in labor force participation rate. Meanwhile Performance of Services and Manufacturing PMI indexes in New Zealand indicated slowing of expansion in both New Zealand’s services and manufacturing sectors in March. At the same time consumer inflation in the first quarter declined over the same period a year ago. Stronger Australian data and softer New Zealand indicators are bullish for AUDNZD.
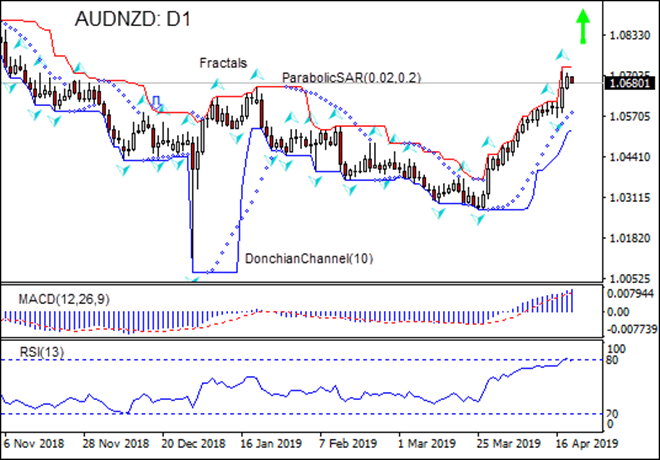
On the daily timeframe the AUDNZD: D1 is retracing after hitting fifteen-week low in the end of March.
- The Parabolic indicator gives a buy signal.
- The Donchian channel indicates uptrend: it is widening up.
- The MACD indicator gives a bullish signal: it is above the signal line and the gap is widening.
- The RSI oscillator is falling back from the overbought zone.
We believe the bullish momentum will continue after the price breaches above the upper boundary of Donchian channel at 1.0728. This level can be used as an entry point for placing a pending order to buy. The stop loss can be placed below the lower bound of Donchian channel at 1.0529. After placing the order, the stop loss is to be moved every day to the next fractal low, following Parabolic signals. Thus, we are changing the expected profit/loss ratio to the breakeven point. If the price meets the stop loss level (1.0529) without reaching the order (1.0728), we recommend cancelling the order: the market has undergone internal changes which were not taken into account.
Technical Analysis Summary
| Position | Buy |
| Buy stop | Above 1.0728 |
| Stop loss | Below 1.0529 |
- Get Certificate

Note:
This overview has an informative and tutorial character and is published for free. All the data, included in the overview, are received from public sources, recognized as more or less reliable. Moreover, there is no guarantee that the indicated information is full and precise. Overviews are not updated. The whole information in each overview, including opinion, indicators, charts and anything else, is provided only for familiarization purposes and is not financial advice or а recommendation. The whole text and its any part, as well as the charts cannot be considered as an offer to make a deal with any asset. IFC Markets and its employees under any circumstances are not liable for any action taken by someone else during or after reading the overview.
